Monitor & Observability @node-llm/monitor
Production observability for NodeLLM. Track costs, latency, token usage, and debug LLM interactions in real-time.
🌍 Internationalization (i18n)
NodeLLM Monitor is built for global teams. The dashboard supports multiple languages and full Right-to-Left (RTL) layouts out of the box.
Features
- Dynamic Language Switching: Toggle between languages instantly without reload.
- Built-in Locales: Ships with English, Spanish, and Arabic (
en,es,ar) translations out of the box. - RTL Support: Seamlessly switch to Arabic with an optimized right-to-left UI layout.
- Extensible Architecture: Add your own languages (e.g. Hebrew, Persian) or override existing translations with simple YAML files via
extendI18n/configureI18n.
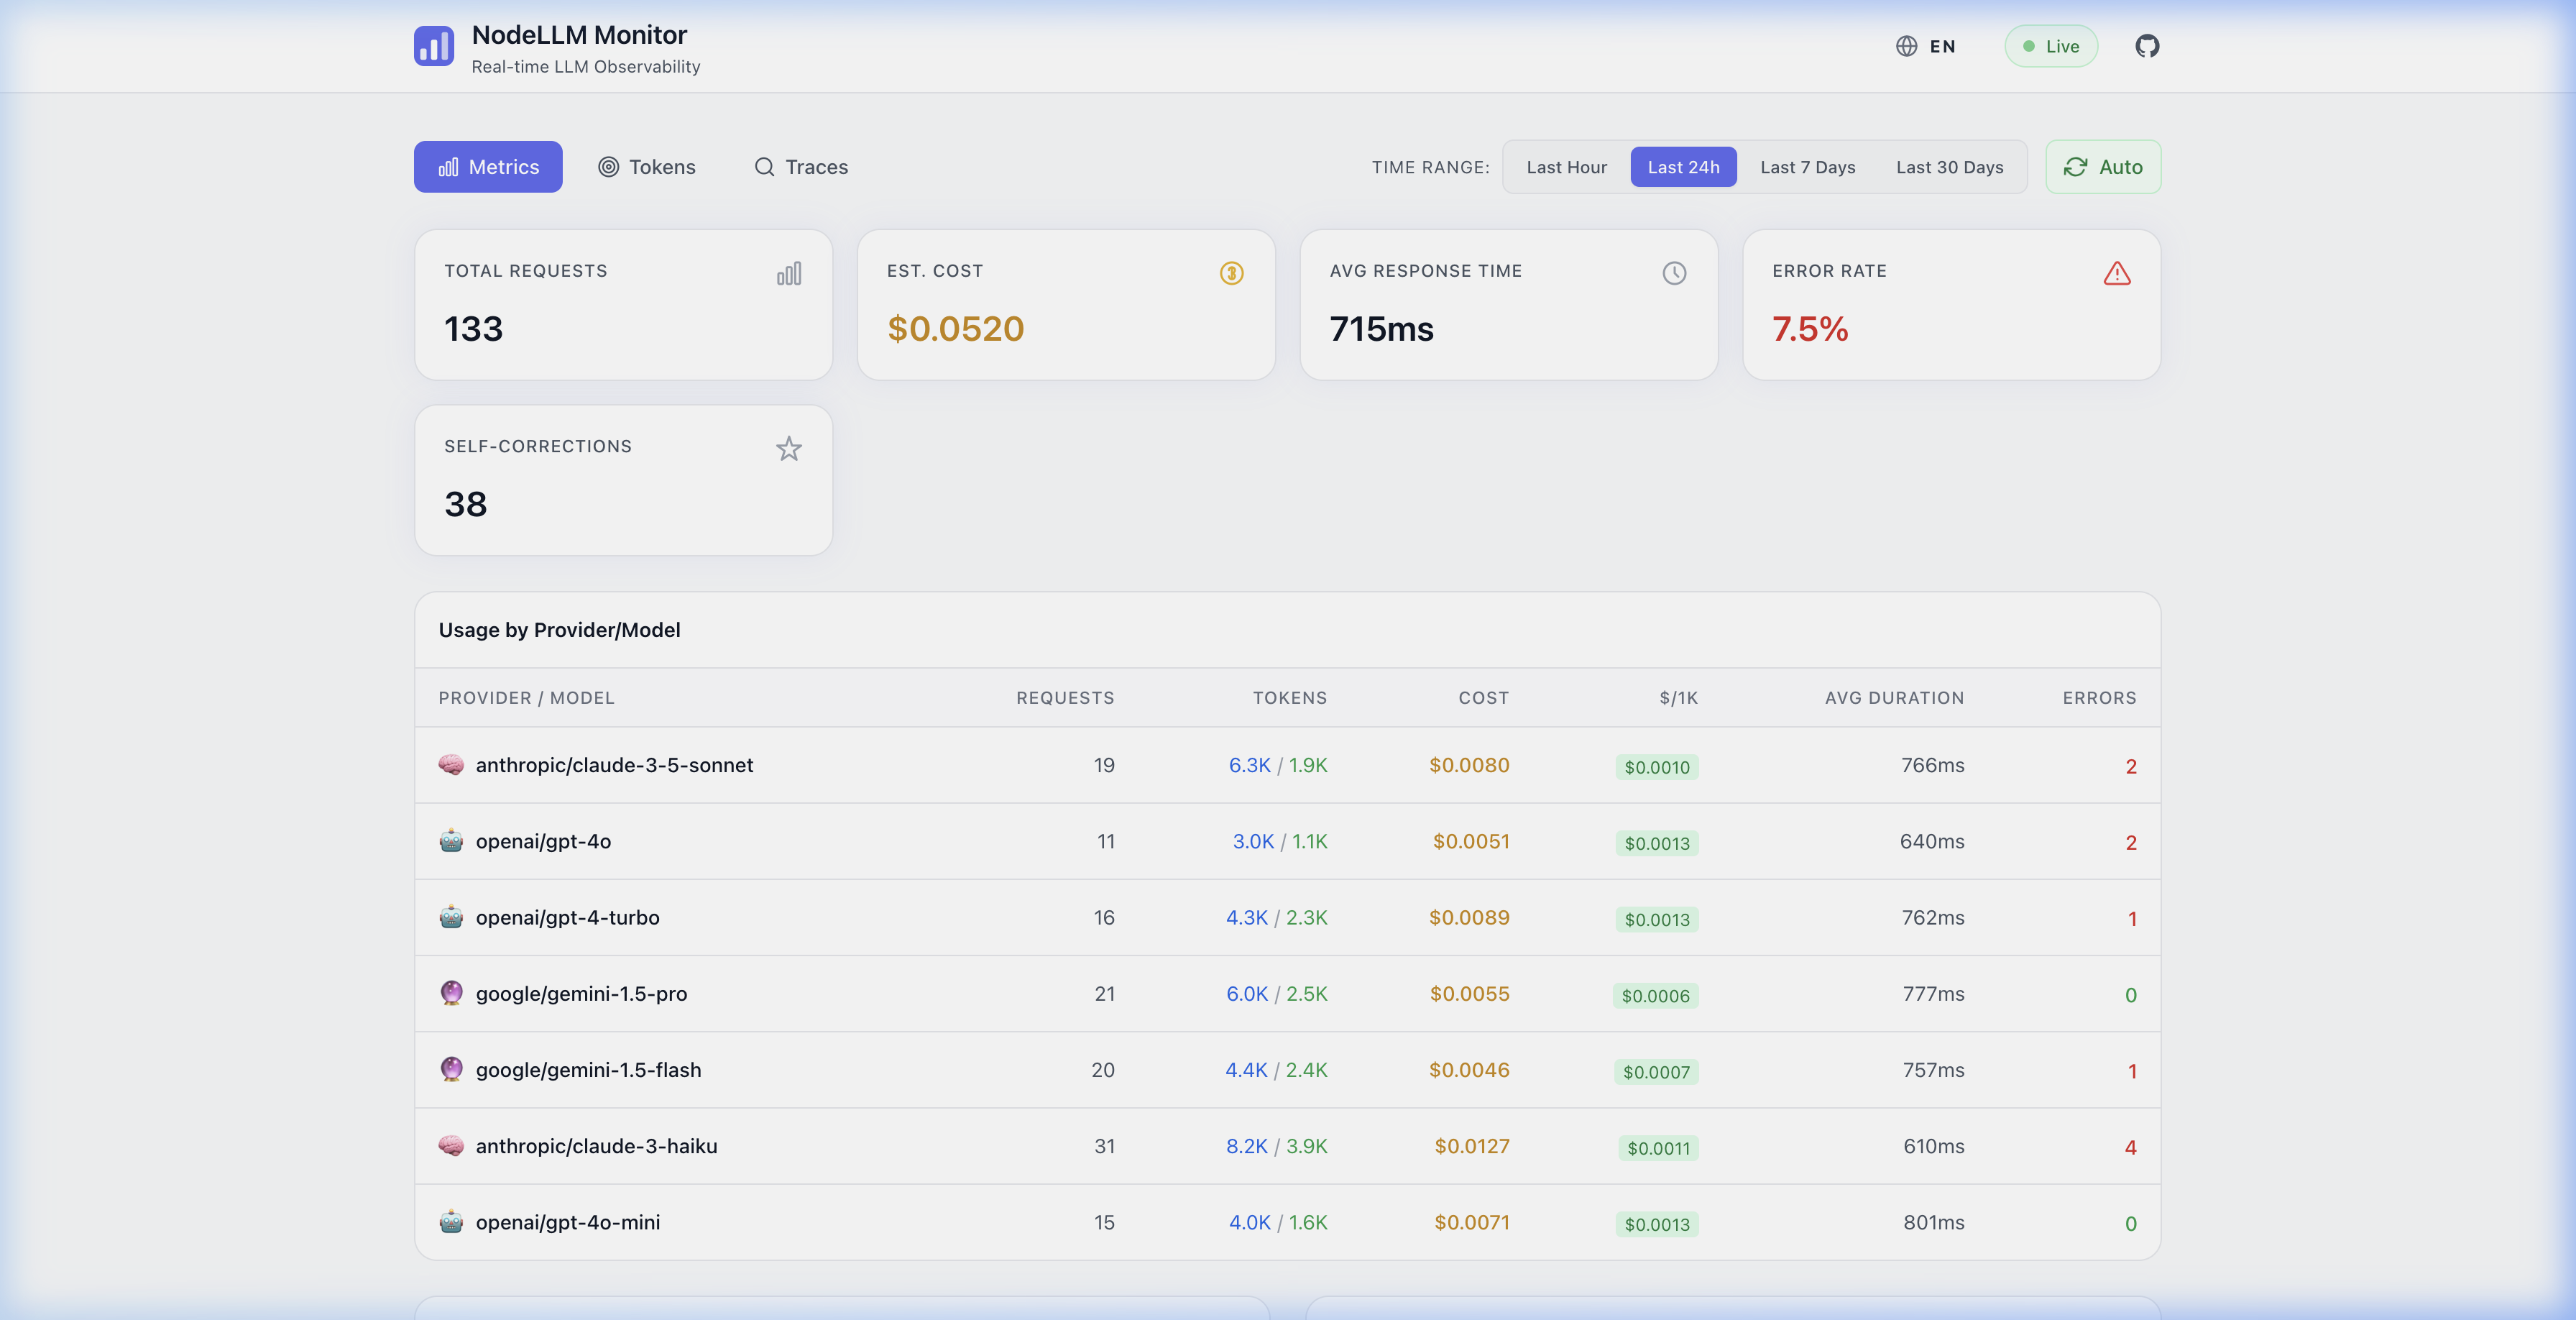
| English (LTR) | Arabic (RTL) |
|---|---|
| Metrics Overview | نظرة عامة على المقاييس |
| 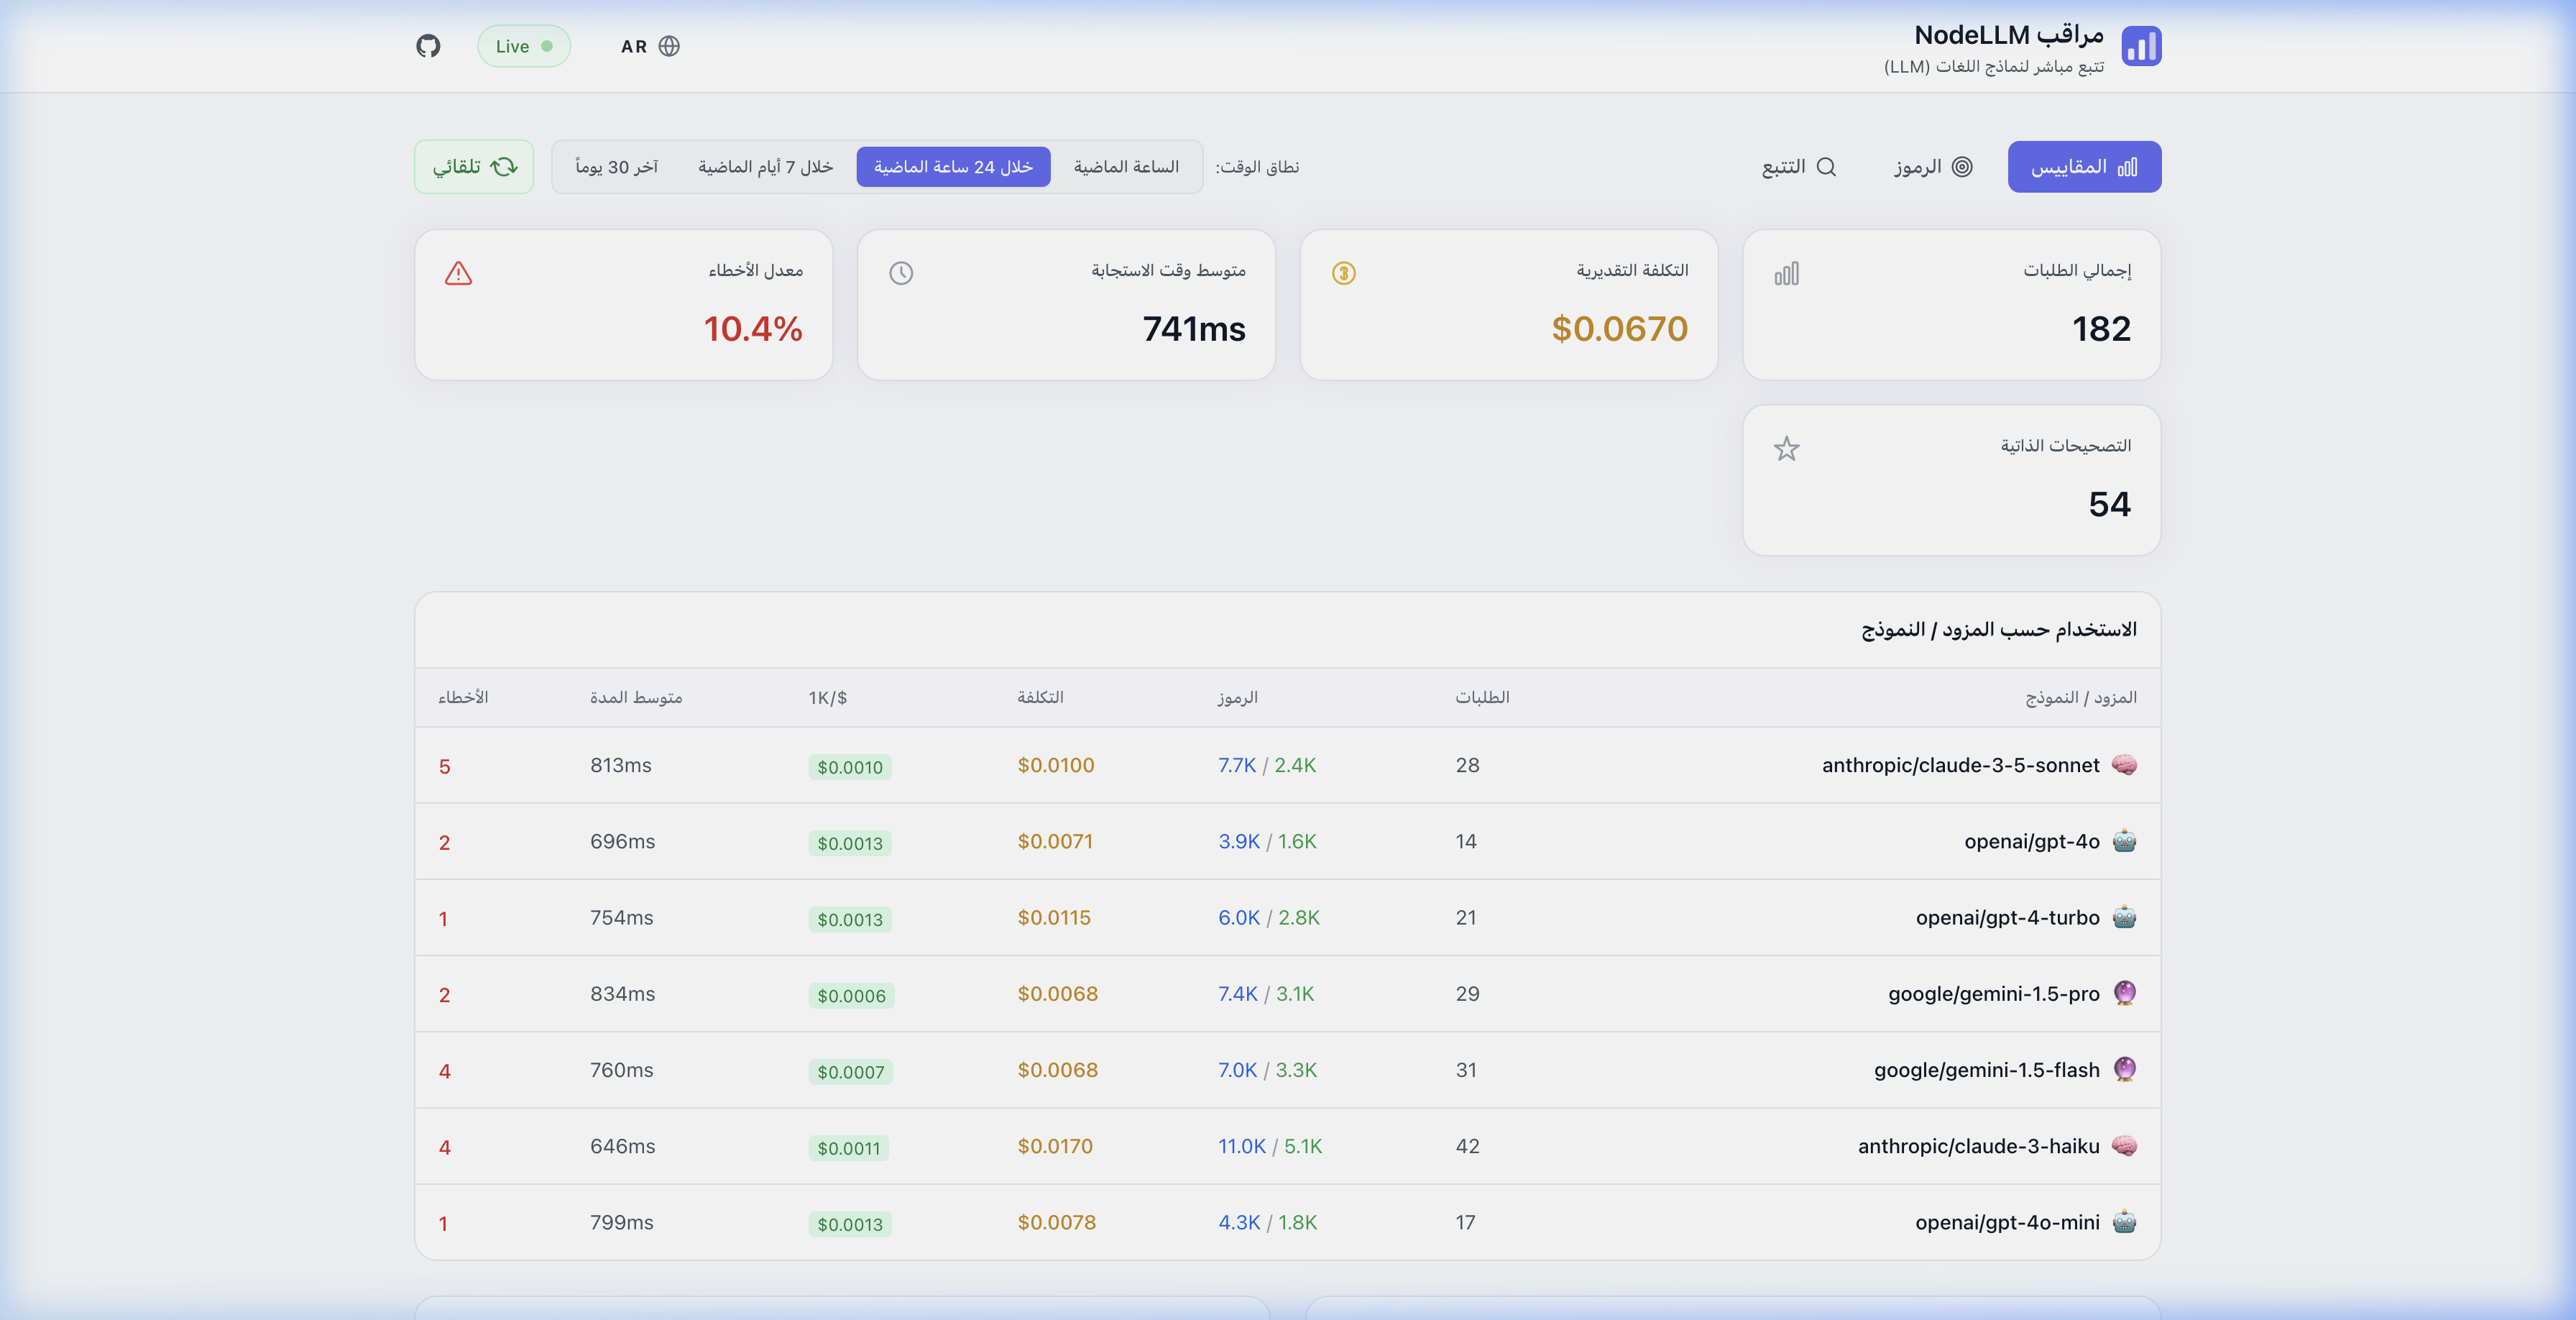 |
| Token Analytics | تحليل الرموز |
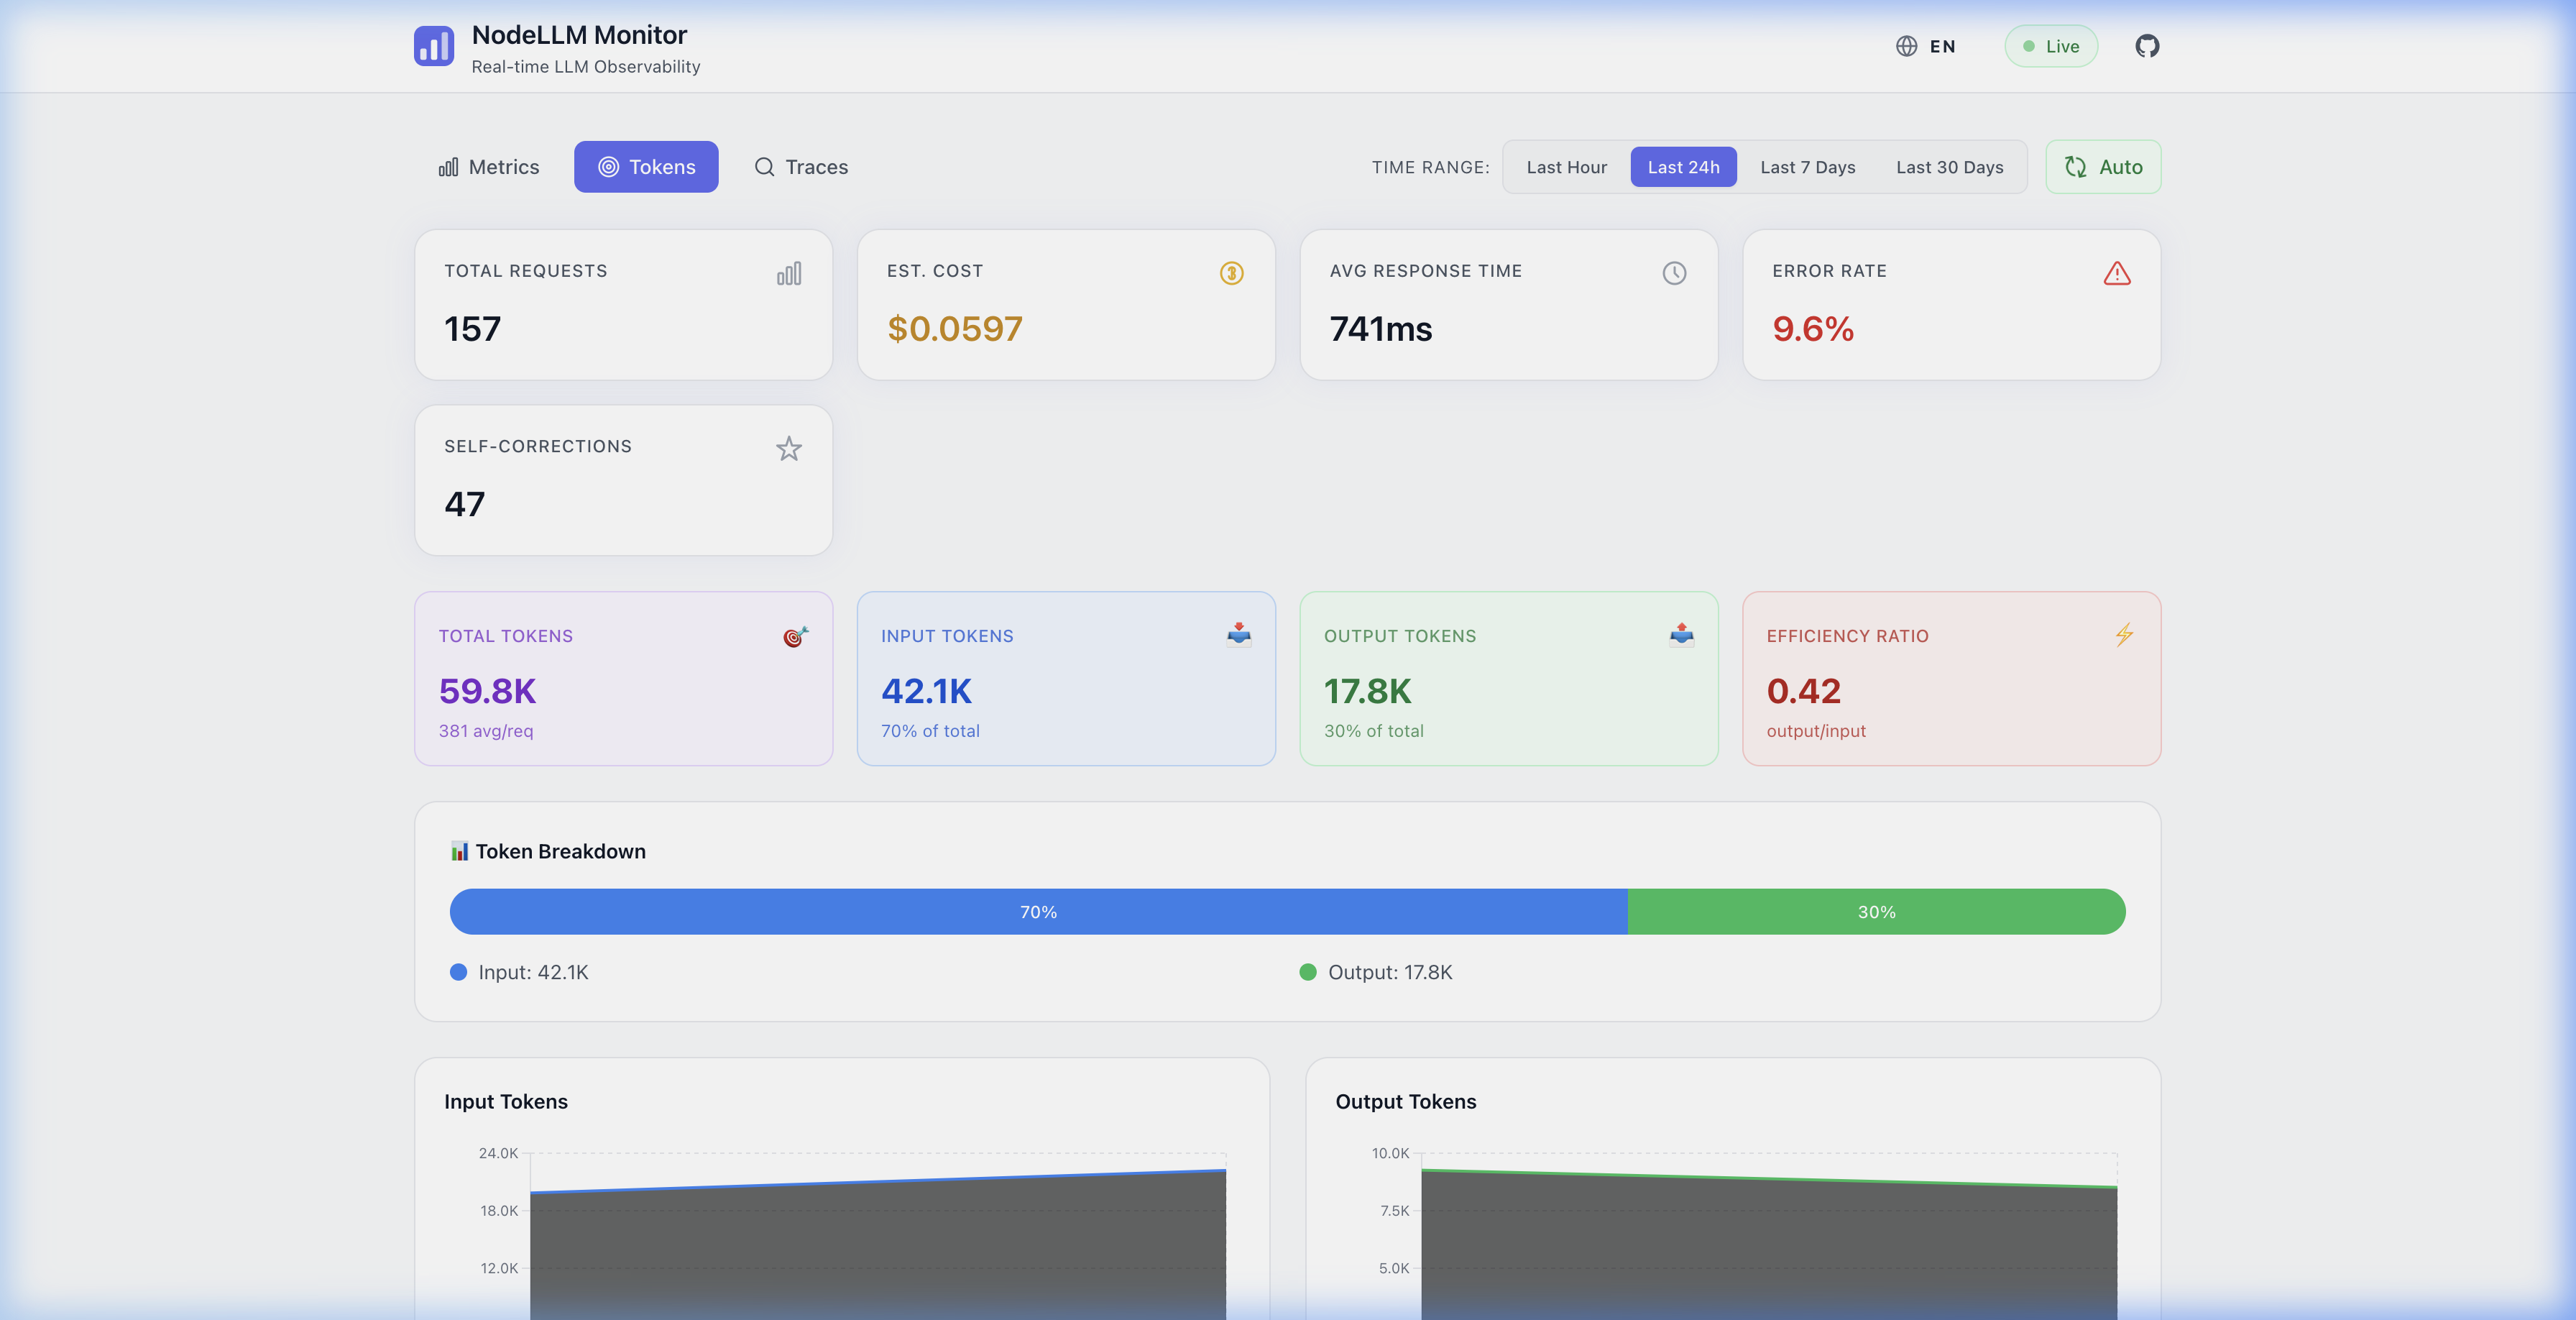 | 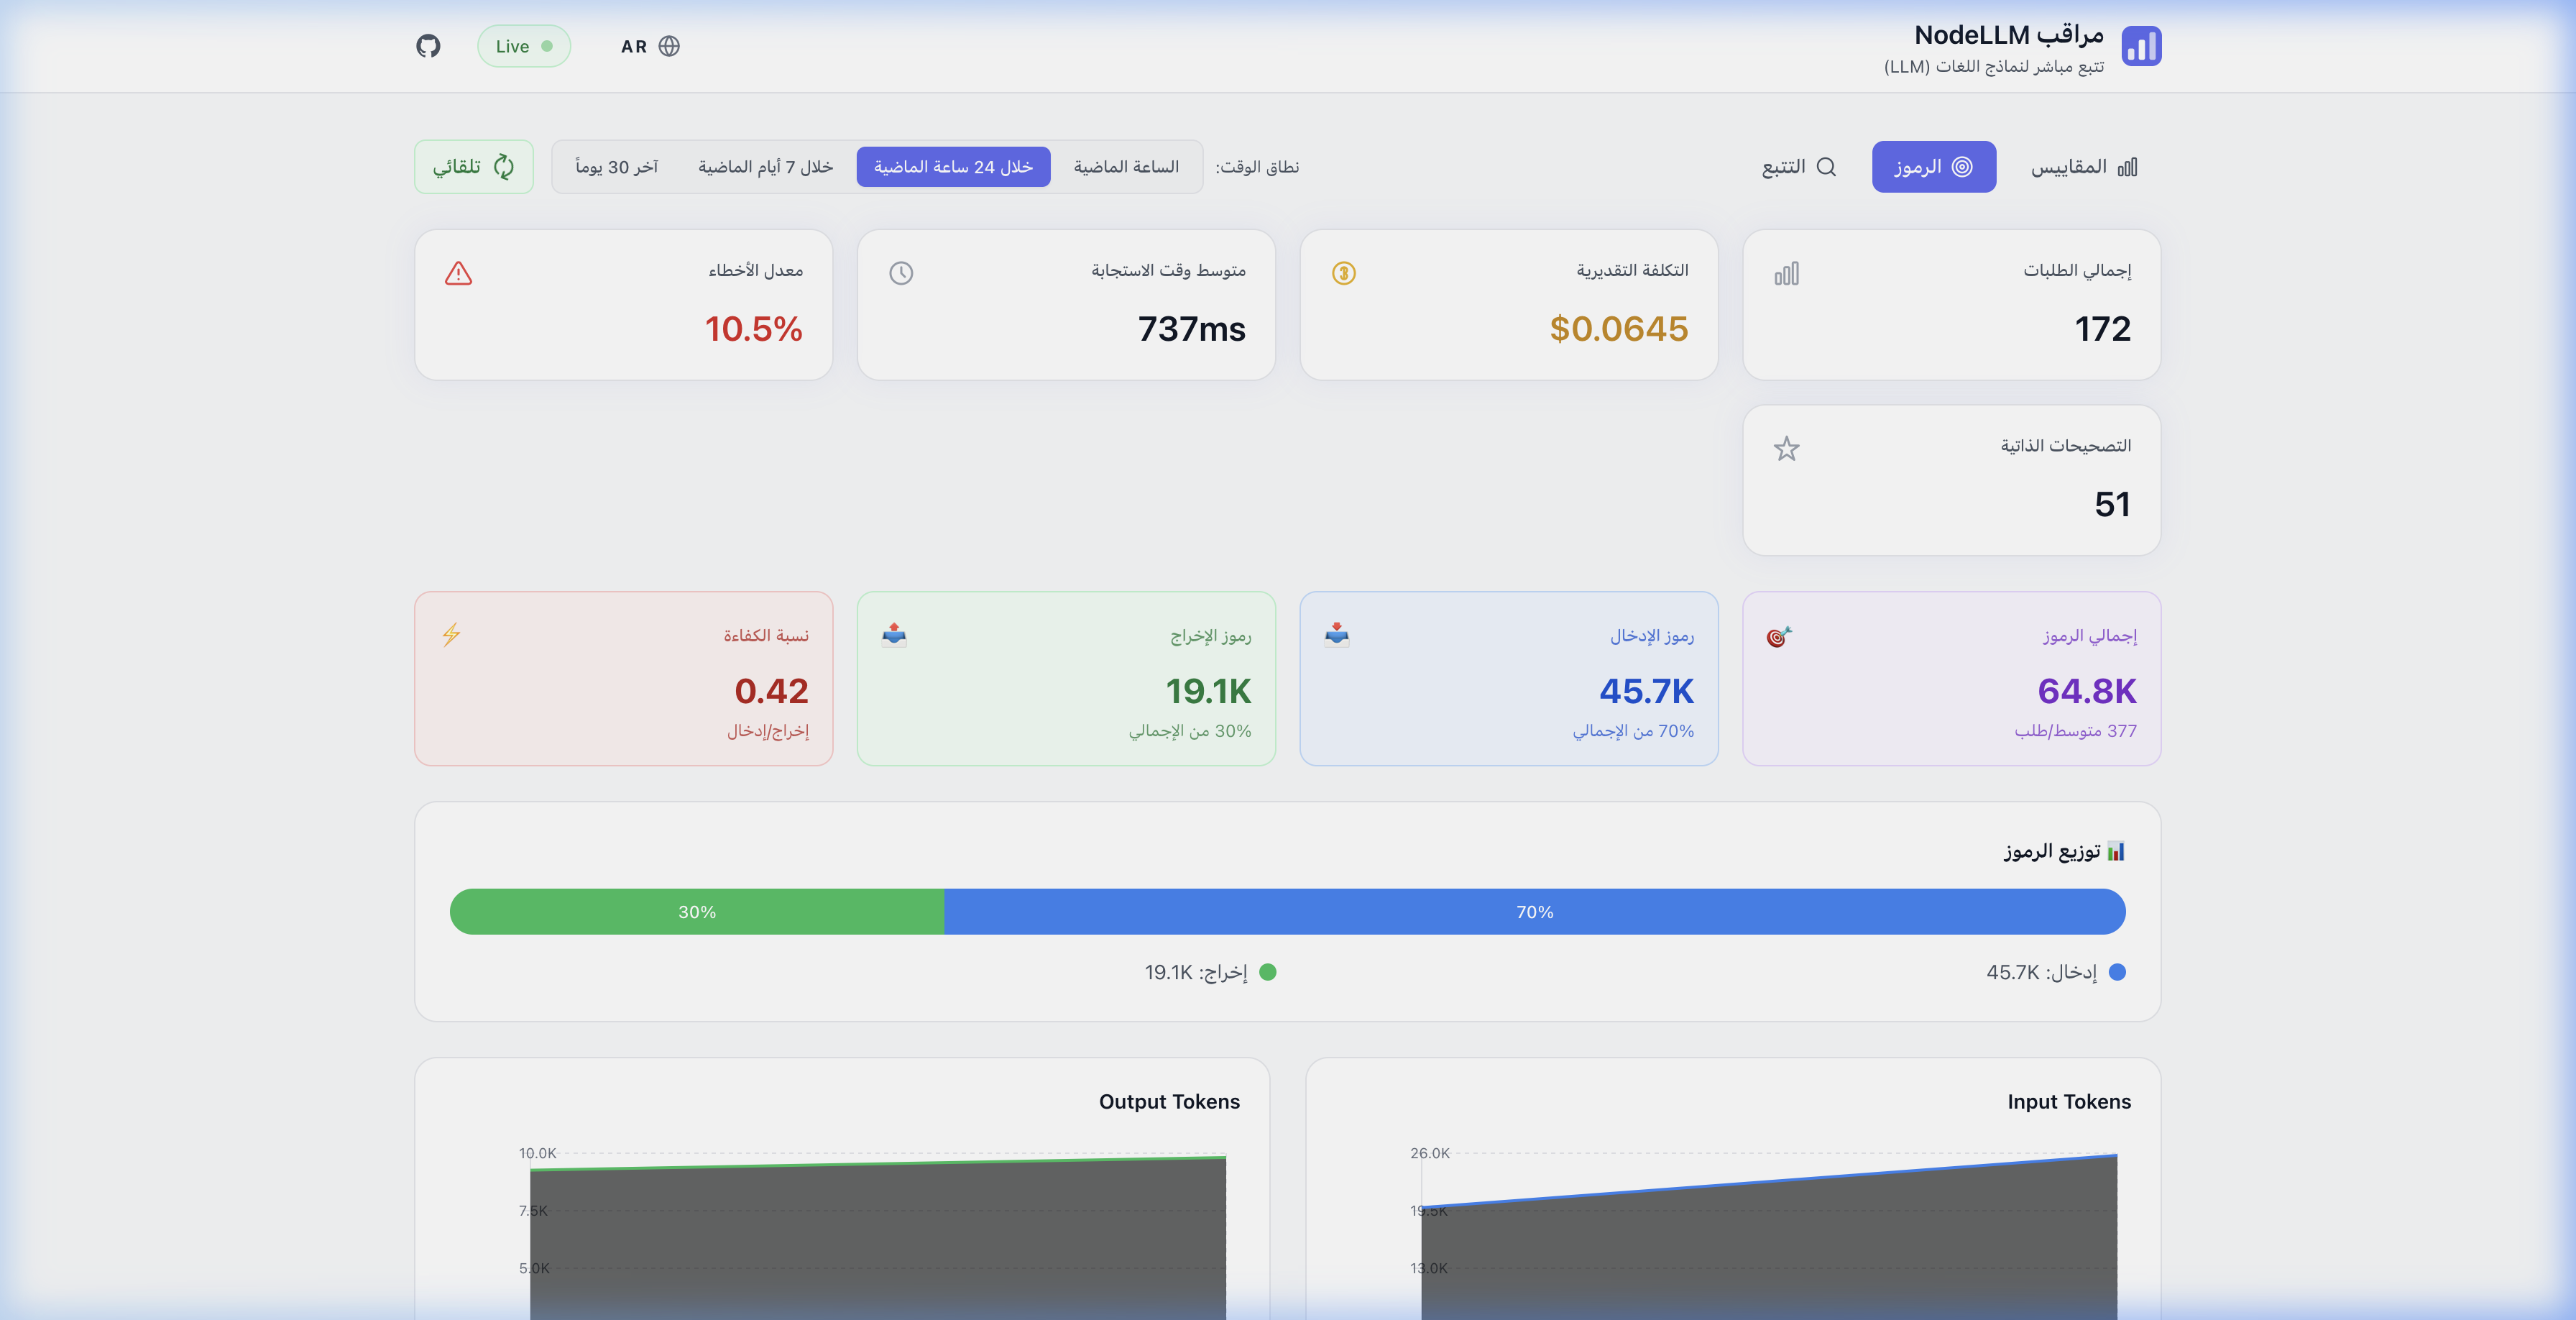 |
| Execution Traces | تتبعات التنفيذ |
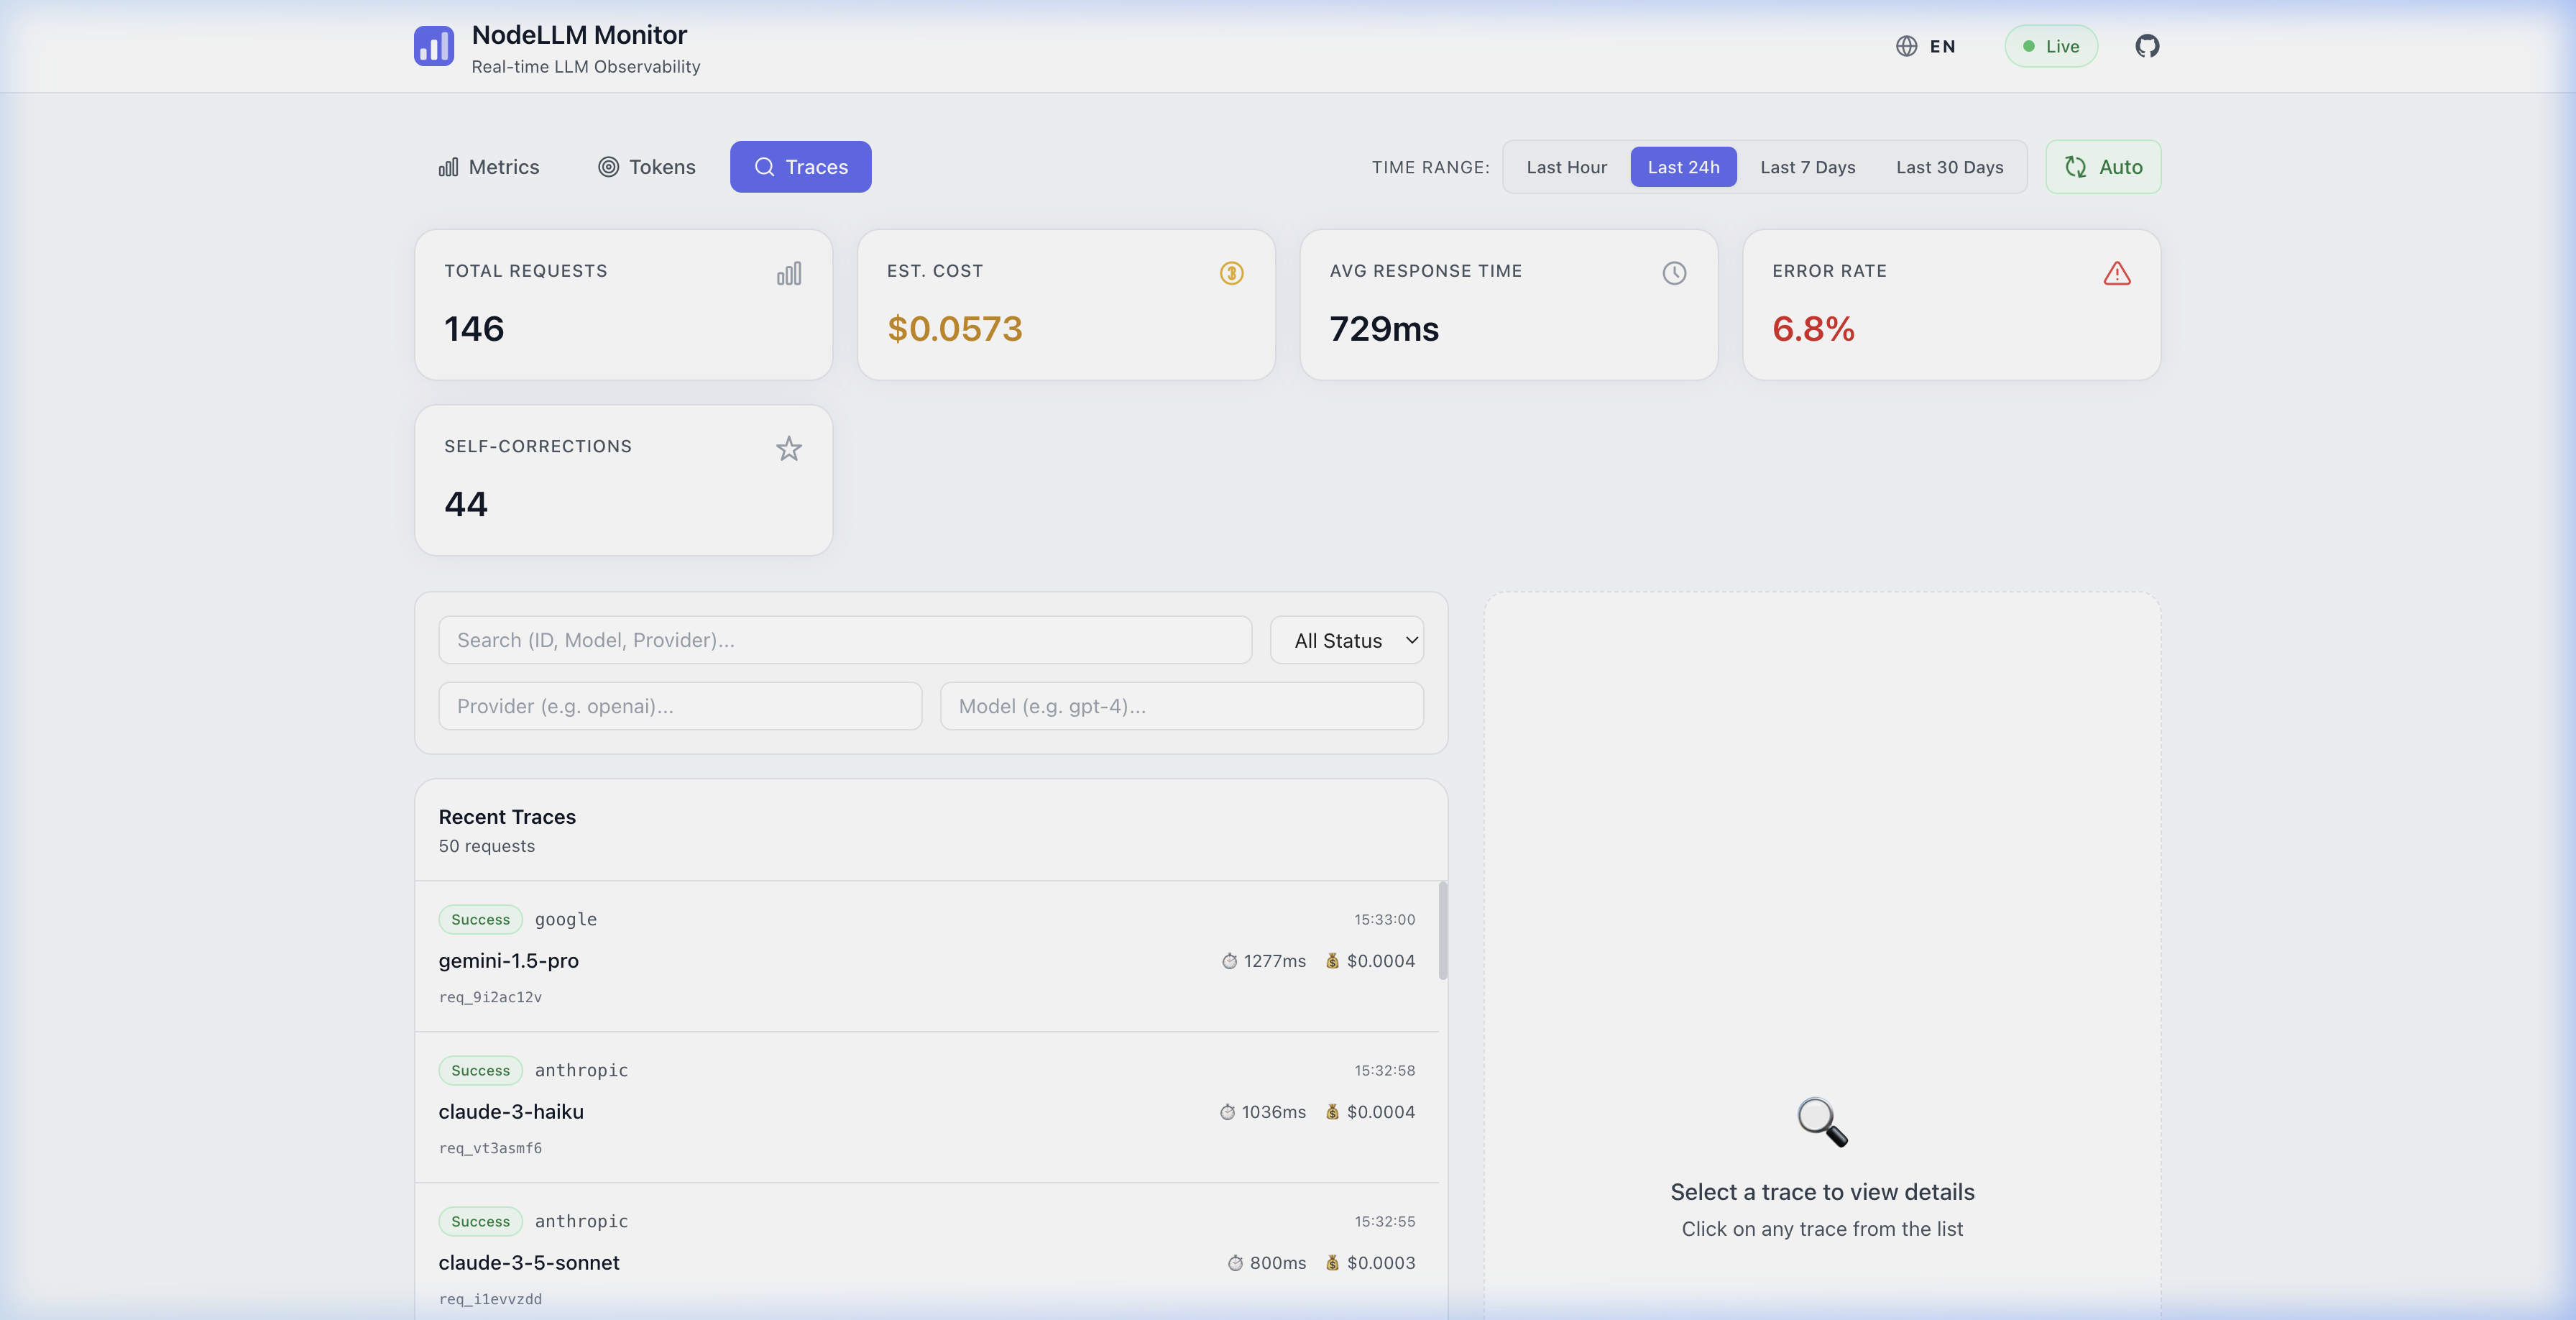 | 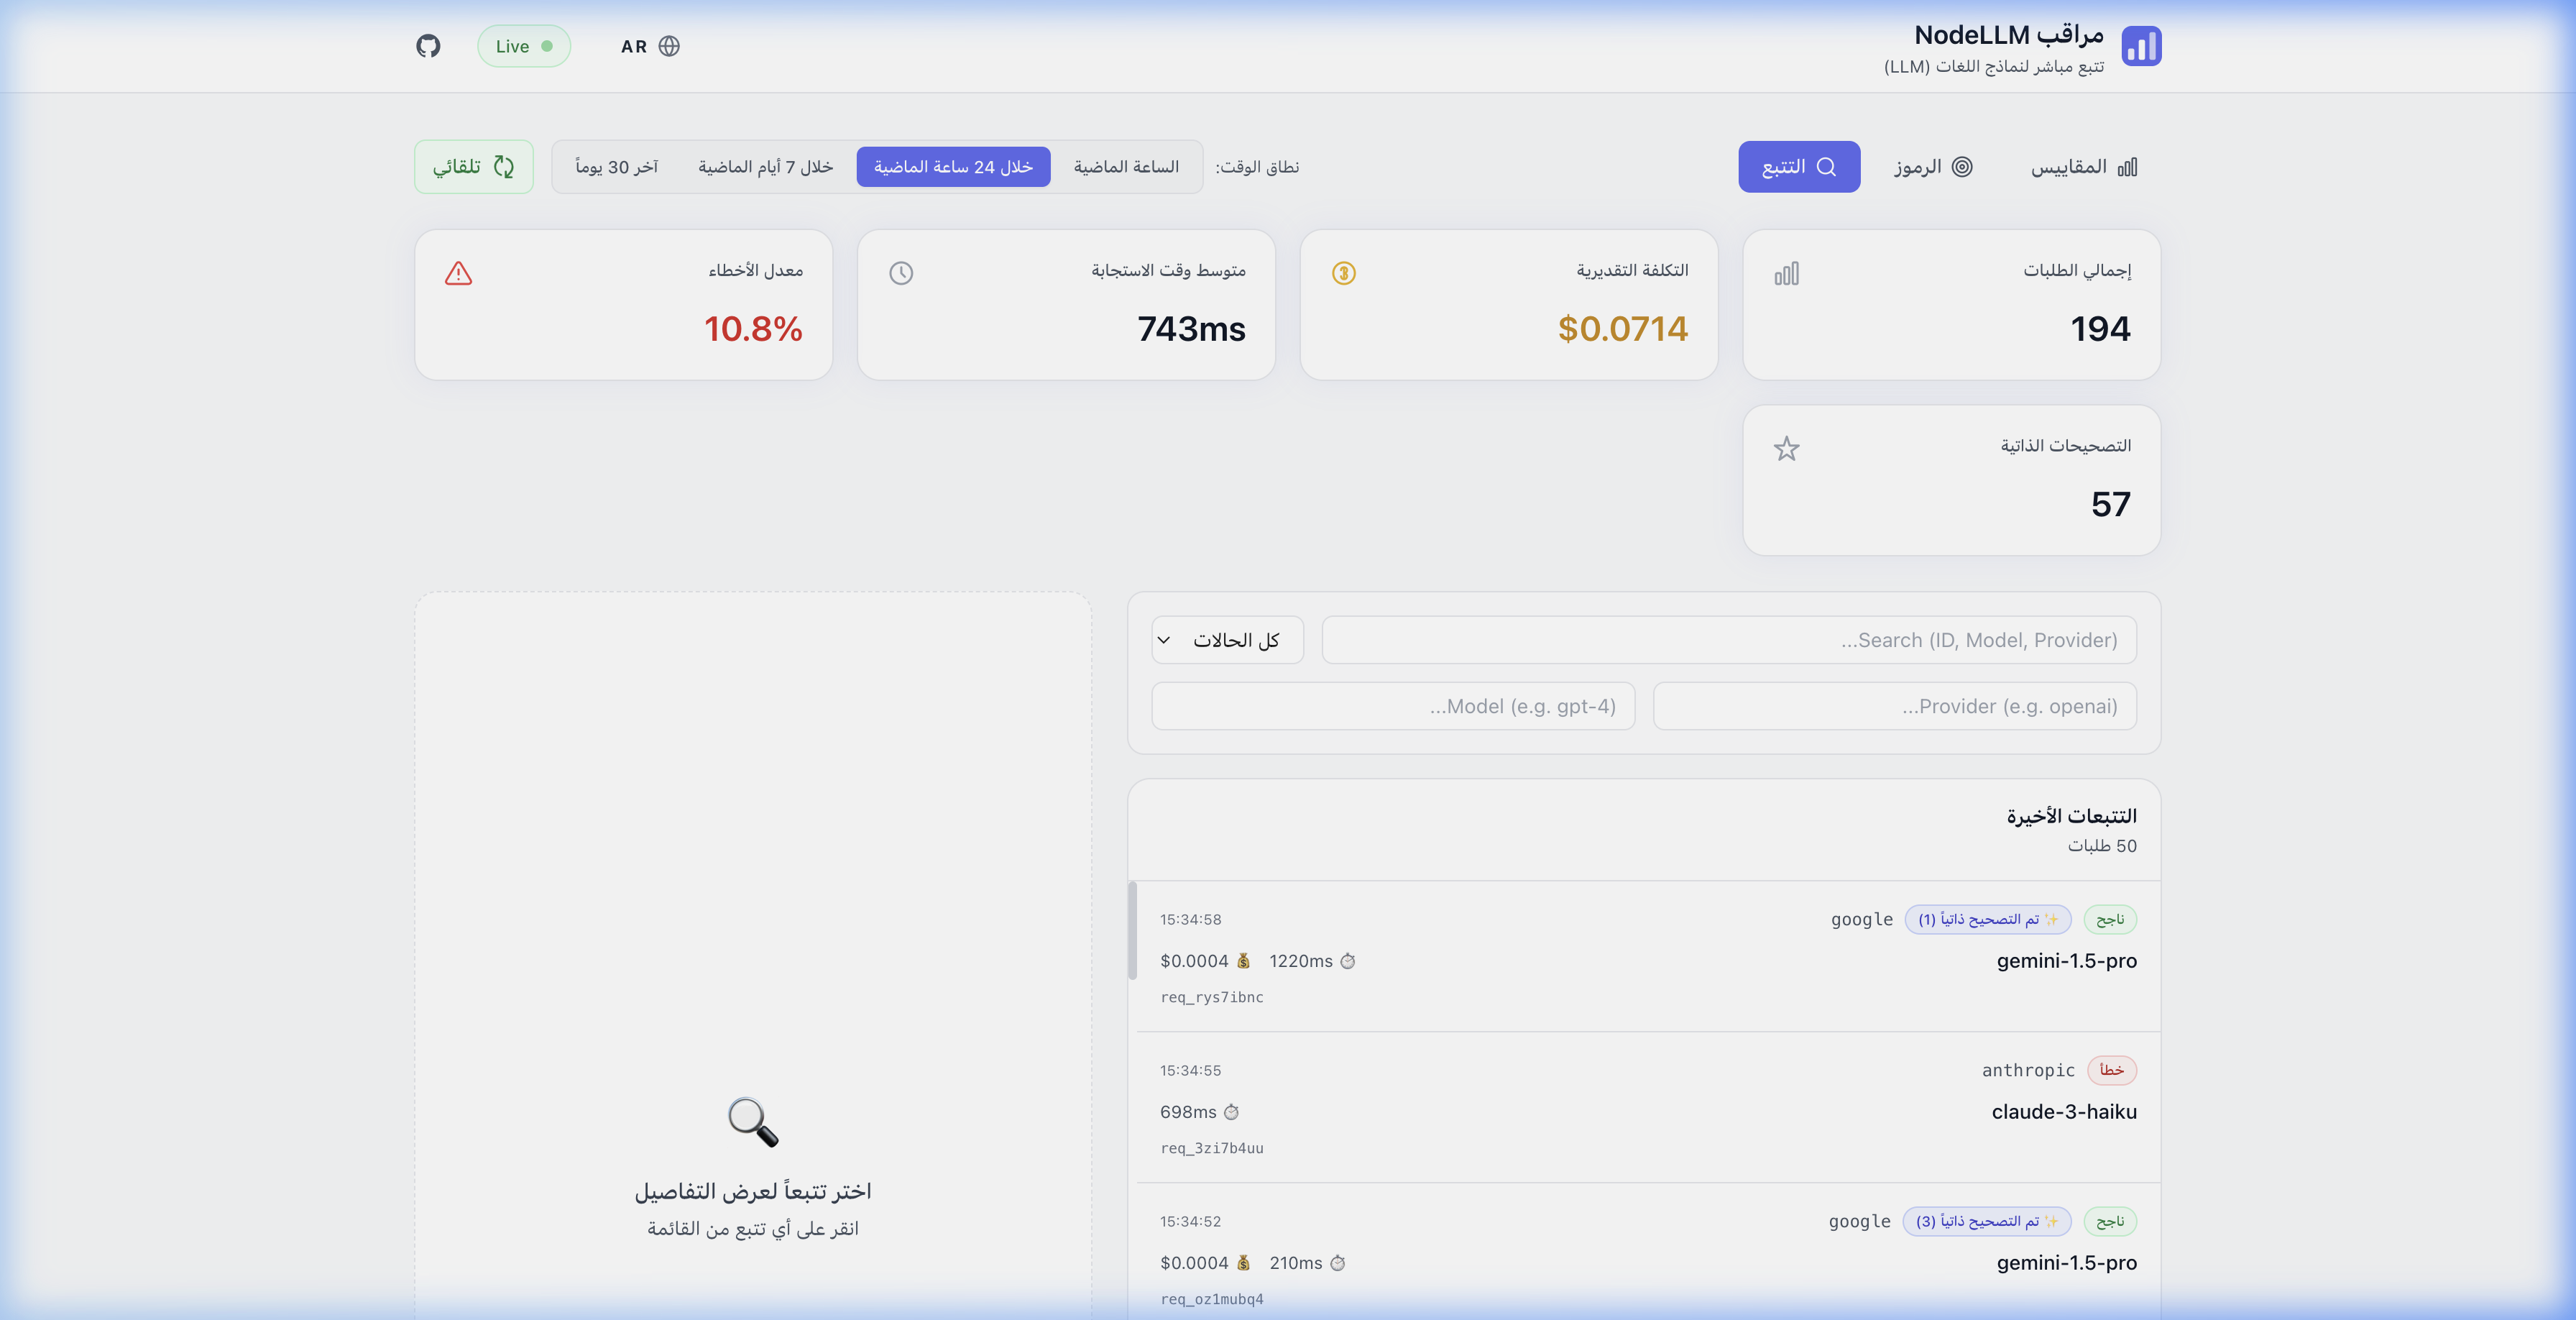 |
Quick Setup
NodeLLM Monitor provides production-grade observability for your AI applications. Track every LLM request, analyze costs, debug issues, and visualize usage patterns through a built-in dashboard.
Installation
# Core monitor package
pnpm add @node-llm/monitor

# Optional: OpenTelemetry integration
pnpm add @node-llm/monitor-otel
Why Monitor?
Building AI applications without observability is like flying blind. NodeLLM Monitor captures:
- Cost Tracking: Know exactly how much each conversation, user, or feature costs
- Latency Analysis: Identify slow requests and optimize performance
- Token Usage: Track input/output tokens across models and providers
- Error Debugging: Capture full request/response payloads for troubleshooting
- Usage Patterns: Understand which models and features are most used
Basic Usage
1. Monitor Setup
Create a Monitor instance with a storage adapter (Memory, File, or Prisma):
import { createLLM } from "@node-llm/core";
import { Monitor } from "@node-llm/monitor";

// Create a monitor with in-memory storage (great for dev/testing)
const monitor = Monitor.memory({
  captureContent: true, // Optional: capture full prompts/responses
});

const llm = createLLM({
  provider: "openai",
  model: "gpt-5-mini",
  openaiApiKey: process.env.OPENAI_API_KEY,
  middlewares: [monitor], // Monitor IS the middleware
});

// All LLM calls are now automatically tracked
const chat = llm.chat();
const response = await chat.ask("Hello!");
Built-in Dashboard
The easiest way to view your telemetry is through the built-in dashboard. You can mount it to any Express server using the ergonomic monitor.api() shorthand:
import express from "express";
import { Monitor } from "@node-llm/monitor";

const app = express();
const monitor = Monitor.memory();

// Launch dashboard at http://localhost:3333/monitor
app.use(monitor.api({ basePath: "/monitor" }));

app.listen(3333);
For advanced usage or non-Express environments, see the Dashboard Guide.
OpenTelemetry Bridge
If you are using the Vercel AI SDK, LangChain, or any other library instrumented with OpenTelemetry, you can use our zero-code bridge to capture AI-specific metrics.
import { NodeTracerProvider } from "@opentelemetry/sdk-trace-node";
import { NodeLLMSpanProcessor } from "@node-llm/monitor-otel";
import { Monitor } from "@node-llm/monitor";

const monitor = Monitor.memory();
const provider = new NodeTracerProvider();

// The span processor automatically extracts model usage, costs, and tools
provider.addSpanProcessor(new NodeLLMSpanProcessor(monitor.getStore()));
provider.register();
See the OpenTelemetry Guide for more details.
Storage Adapters
NodeLLM Monitor supports multiple storage backends:
Memory Adapter (Development)
import { Monitor } from "@node-llm/monitor";

const monitor = Monitor.memory();
Perfect for development and testing. Data is lost on restart.
File Adapter (Prototyping)
import { createFileMonitor } from "@node-llm/monitor";

const monitor = createFileMonitor("./llm-events.log");
Persist events to a JSON file. Good for prototyping.
Prisma Adapter (Production)
import { PrismaClient } from "@prisma/client";
import { createPrismaMonitor } from "@node-llm/monitor";

const prisma = new PrismaClient();

const monitor = createPrismaMonitor(prisma, {
  captureContent: false, // PII protection (default)
});
Production-ready with full query capabilities. See Prisma Setup.
Content Scrubbing
Protect sensitive data with automatic content scrubbing:
import { Monitor, MemoryAdapter } from "@node-llm/monitor";

const monitor = new Monitor({
  store: new MemoryAdapter(),
  captureContent: true, // Enable content capture
  scrubbing: {
    pii: true,     // Scrub emails, phone numbers, SSNs
    secrets: true, // Scrub API keys, passwords
  },
});
By default, when captureContent is enabled, PII and secrets are automatically scrubbed.
Scrubbed patterns include:
- Email addresses →
[EMAIL] - Phone numbers →
[PHONE] - SSN/Tax IDs →
[SSN] - API keys →
[API_KEY] - Passwords →
[PASSWORD]
Event Types
The monitor captures these event types:
| Event | Description |
|---|---|
request.start | LLM request initiated |
request.end | LLM request completed |
request.error | LLM request failed |
tool.start | Tool call initiated |
tool.end | Tool call completed |
tool.error | Tool call failed |
Each event includes:
- Request ID, Session ID, and Transaction ID
- Provider and Model
- Token usage (input/output/total)
- Cost calculation
- Latency timing (duration, CPU time, allocations)
- Full request/response payloads (if
captureContentis enabled)
Time Series Aggregation
Analyze trends with built-in time series queries:
import { TimeSeriesBuilder } from "@node-llm/monitor";

// Create builder with bucket size (default: 5 minutes)
const builder = new TimeSeriesBuilder(5 * 60 * 1000);

// Build time series from events
const timeSeries = builder.build(events);
// Returns: { requests: [...], cost: [...], duration: [...], errors: [...] }

// Get stats grouped by provider/model
const providerStats = builder.buildProviderStats(events);
// Returns: [{ provider, model, requests, cost, avgDuration, errorCount }, ...]
The adapters also provide a getMetrics() method that returns pre-aggregated data:
const metrics = await store.getMetrics({ from: new Date(Date.now() - 24 * 60 * 60 * 1000) });
console.log(metrics.totals);      // { totalRequests, totalCost, avgDuration, errorRate }
console.log(metrics.byProvider);  // Provider breakdown
console.log(metrics.timeSeries);  // Time series data
Next Steps
- Prisma Adapter Setup - Production database integration
- Dashboard Guide - Explore the visual interface
- OpenTelemetry Guide - Instrumented trace extraction
- API Reference - Full API documentation
- Blog: NodeLLM Monitor - Deep dive into production observability