Dashboard @node-llm/monitor
Built-in web dashboard for visualizing LLM usage, costs, and performance metrics.
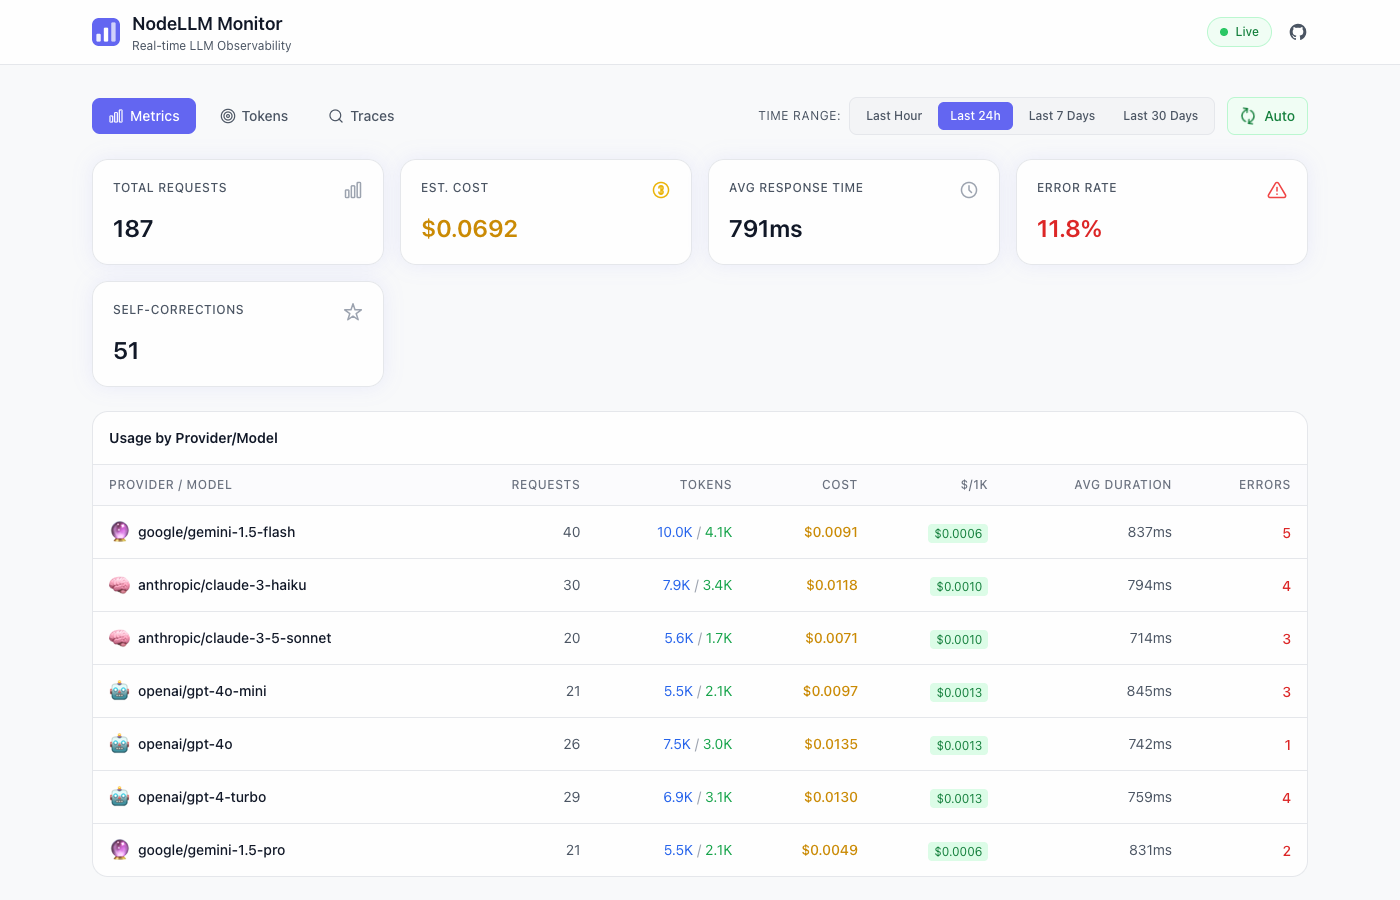
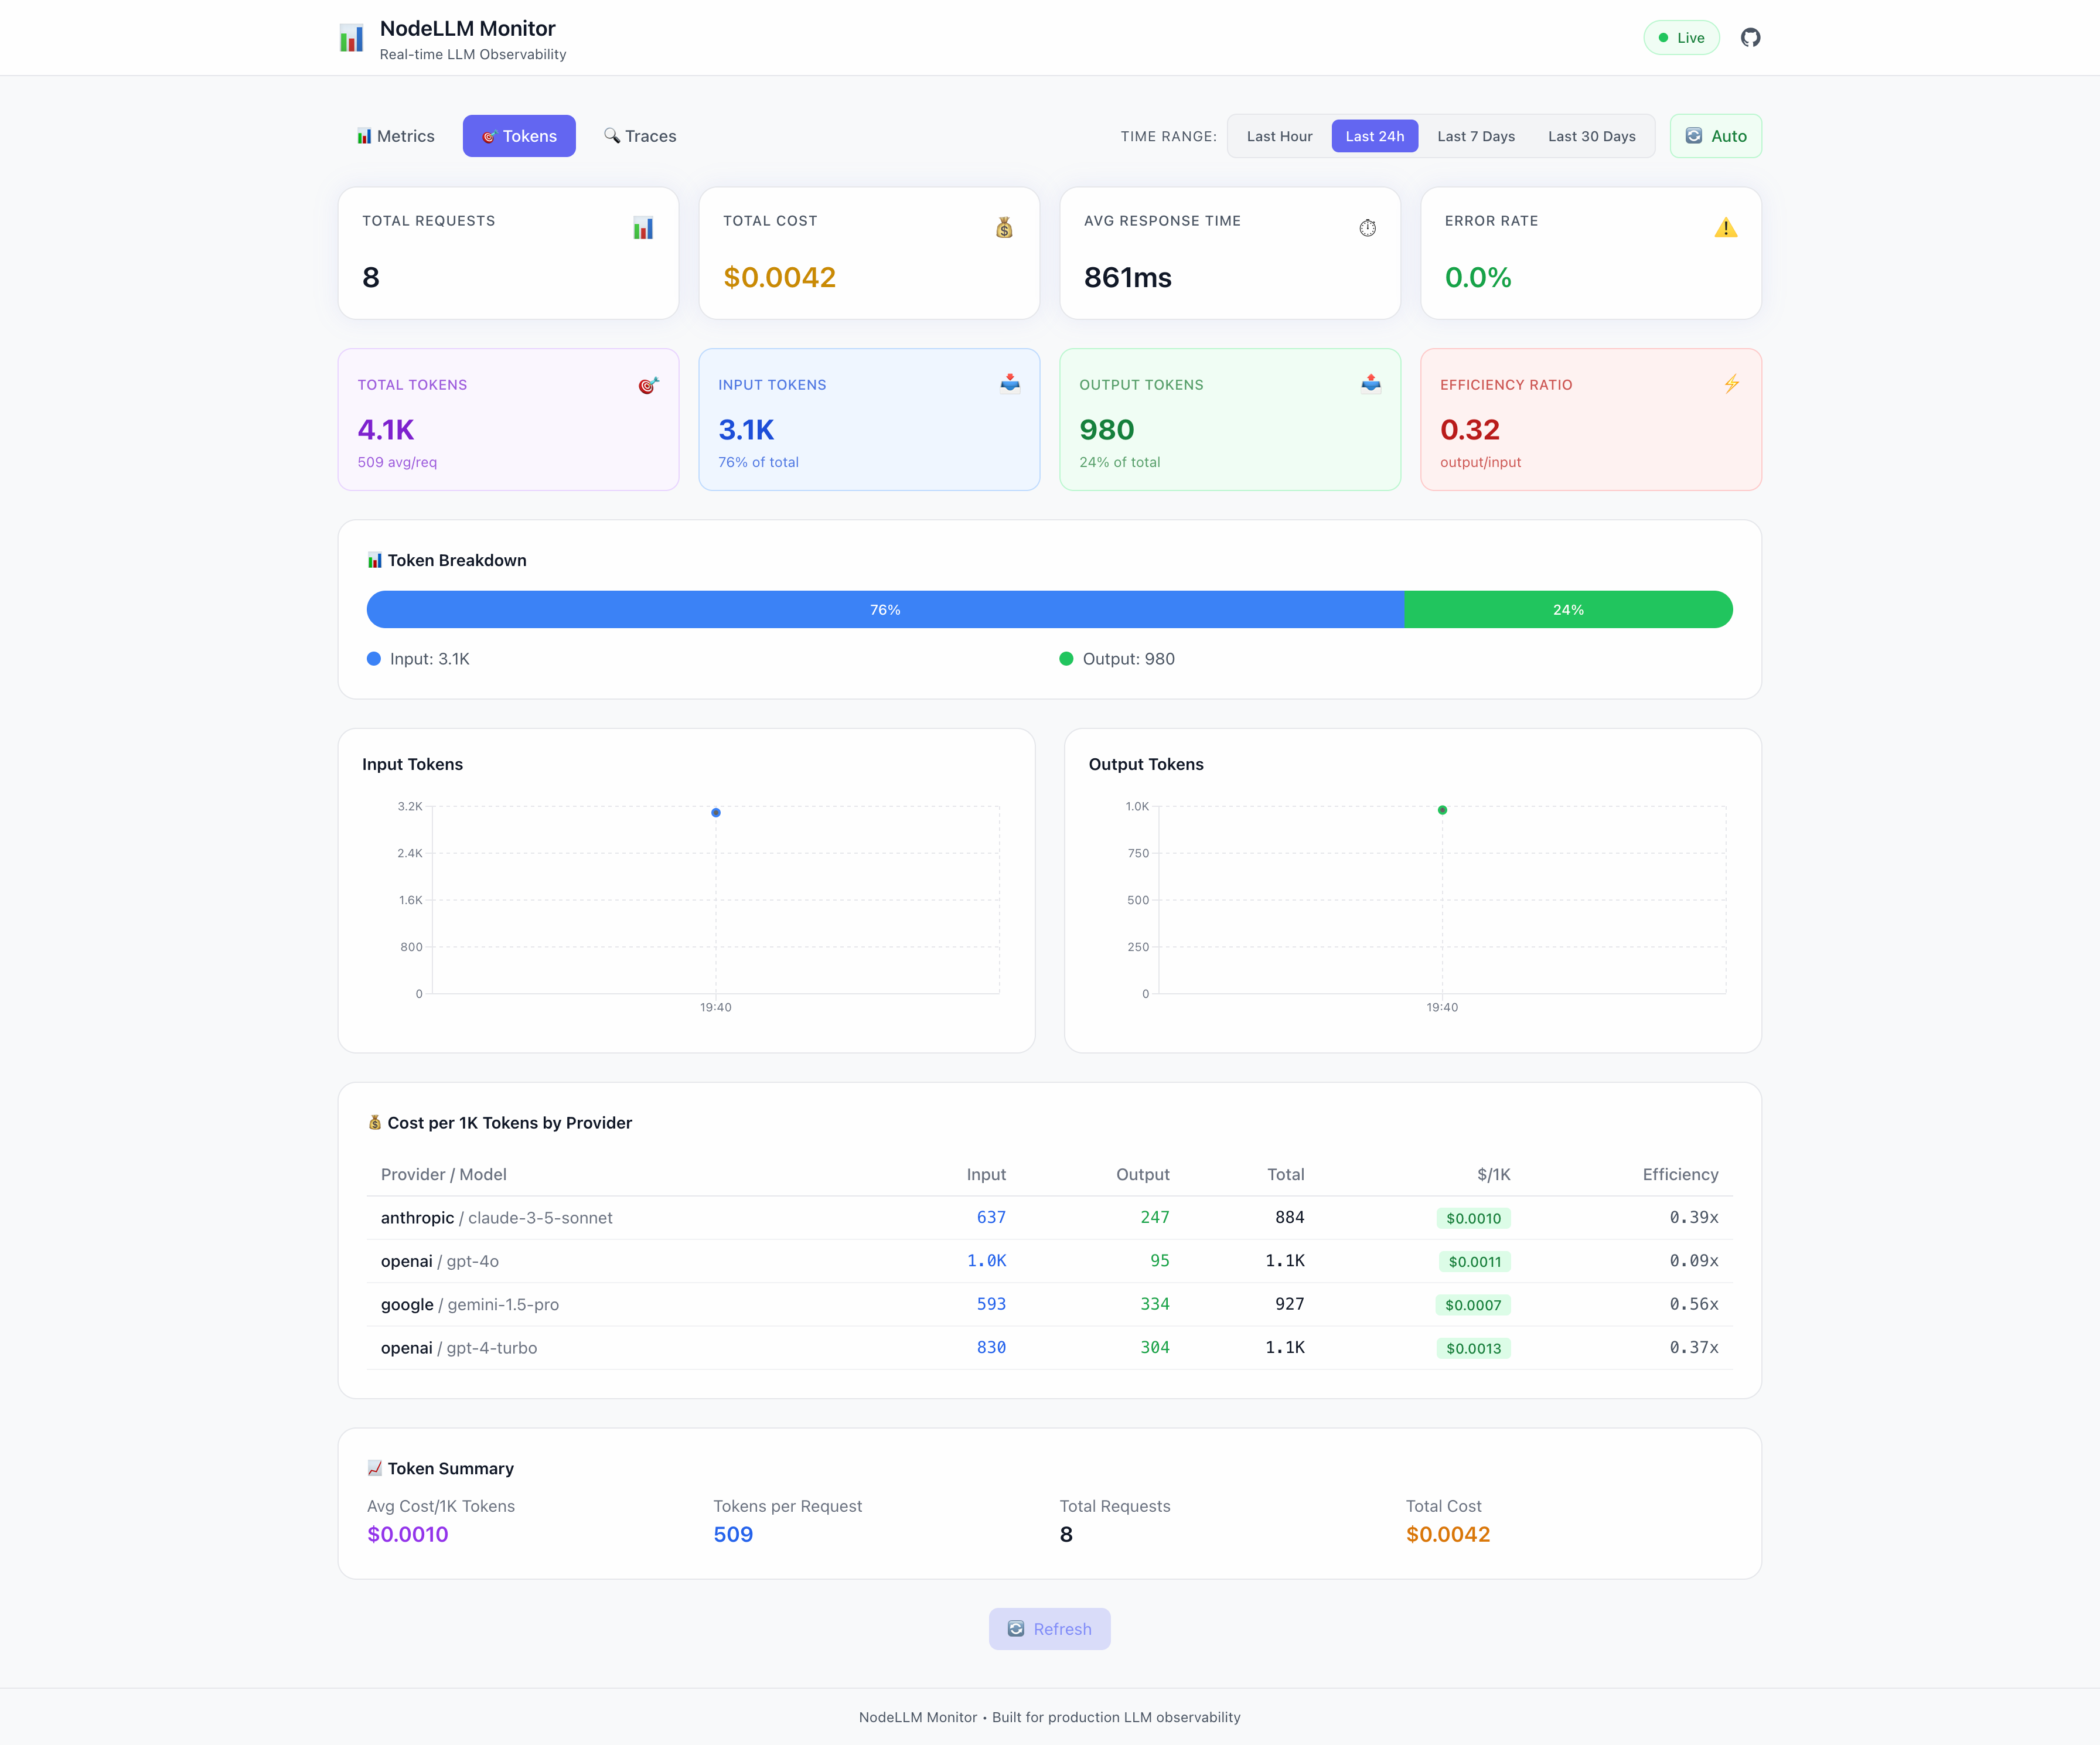
Table of contents
Overview
The NodeLLM Monitor Dashboard is a production-ready UI that visualizes your LLM telemetry. Unlike other tools that require external services, this dashboard is embedded directly into your application as a middleware or route handler.
It provides:
- Real-time Metrics: Costs, token usage, and latency.
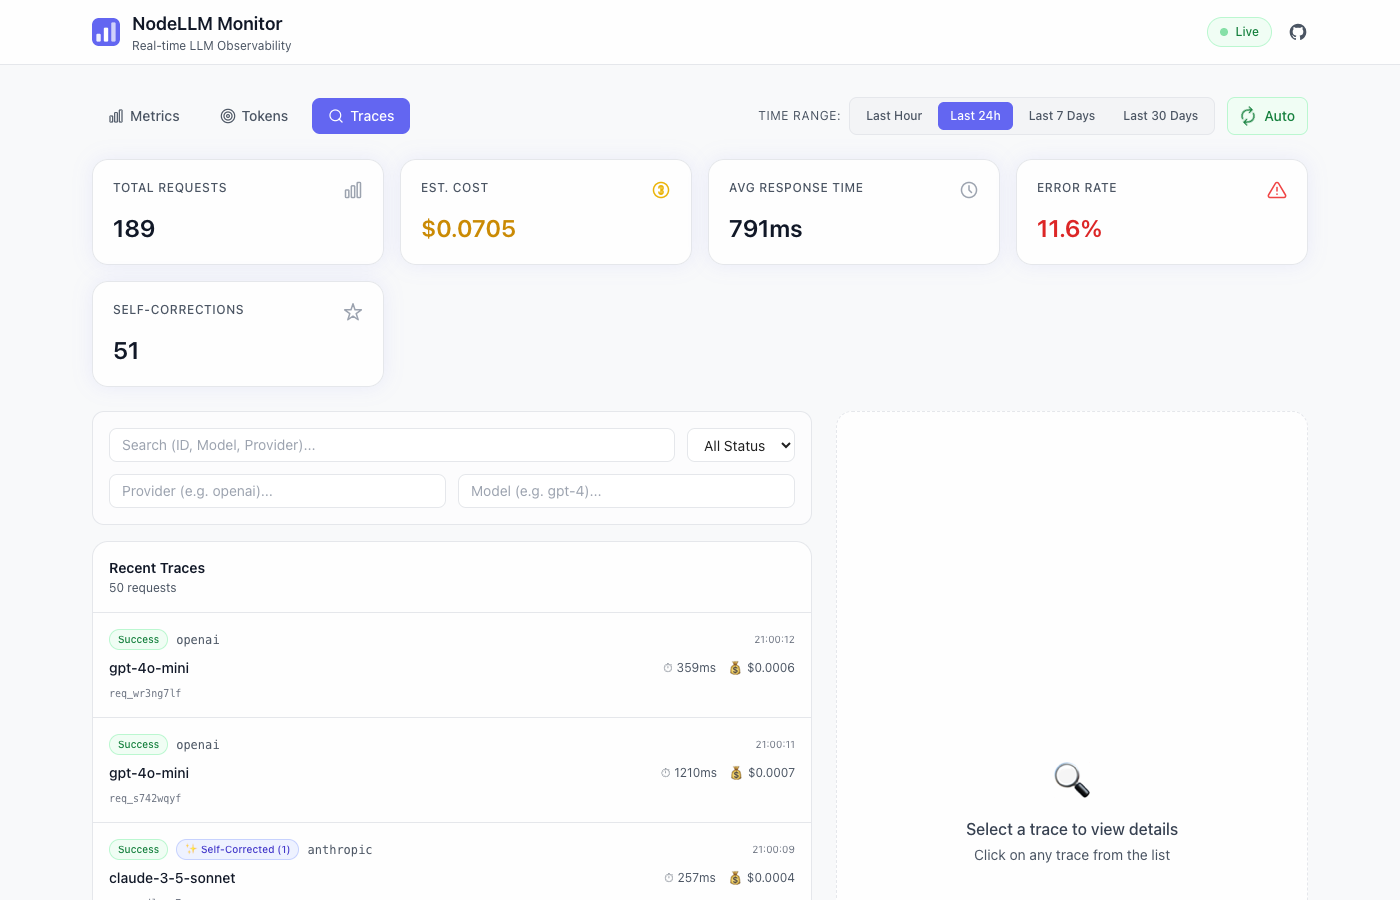
- Trace Explorer: Inspect full request/response payloads.
- Provider Breakdown: Compare models and providers.
- Time-Series Analysis: Visual trends over time.
- Self-Repair Tracking: Observe LLM self-correction efficiency.
🛠 Self-Repair Observability
The dashboard includes first-class support for observing Schema Self-Correction. When an agent encounters a validation error (e.g., Zod error, Tool format mismatch) and automatically repairs it, the monitor captures the “Correction Rounds” required.
Features:
- Correction Counter: See the total number of automated repairs managed by your system across the selected time range.
- Trace Badges: Requests that required correction are clearly marked with a ✨ Self-Corrected (N) badge in the trace explorer, where
Nis the number of repair rounds. - Repair History: Drill down into any trace to see the specific sequence of failures that led to the final successful repair.
Integration
Express (Recommended)
The easiest way to integrate the dashboard is using the api() method on your monitor instance:
import express from "express";
import { Monitor } from "@node-llm/monitor";

const app = express();
const monitor = Monitor.memory();

// Dashboard handles its own routing under basePath
app.use(monitor.api({ basePath: "/monitor" }));

app.listen(3333, () => {
  console.log("Dashboard at http://localhost:3333/monitor");
});
Manual Integration (Non-Express)
For standard Node.js HTTP servers or custom mount logic, use the MonitorDashboard class directly:
import { createServer } from "node:http";
import { MonitorDashboard, MemoryAdapter } from "@node-llm/monitor";

const store = new MemoryAdapter();
const dashboard = new MonitorDashboard(store, { basePath: "/monitor" });

const server = createServer(async (req, res) => {
  await dashboard.handleRequest(req, res);
});

server.listen(3333);
Next.js App Router
Use createMonitoringRouter to create a standard Web API route handler:
// app/api/monitor/[...path]/route.ts
import { PrismaClient } from "@prisma/client";
import { PrismaAdapter } from "@node-llm/monitor";
import { createMonitoringRouter } from "@node-llm/monitor/ui";

const prisma = new PrismaClient();
const adapter = new PrismaAdapter(prisma);

const { GET, POST } = createMonitoringRouter(adapter, {
  basePath: "/api/monitor",
});

export { GET, POST };
For the UI pages, you can either serve them via this API route (SPAs) or build a custom page that consumes these endpoints.
Configuration
The dashboard factories accept an options object:
interface MonitorDashboardOptions {
  /** Base path for mounting. Default: "/monitor" */
  basePath?: string;

  /** CORS configuration for API endpoints */
  cors?: boolean | string | string[] | { origin: string | string[]; credentials?: boolean };

  /** Polling interval (ms) for the UI. Default: 5000 */
  pollInterval?: number;

  /** Enable debug logging. Default: false */
  debug?: boolean;

  /** Internationalization configuration */
  i18n?: {
    /** Custom dashboard title */
    title?: string;
    /** Supported languages (e.g. ['en', 'ar']) */
    supportedLngs?: string[];
    /** Default language */
    lng?: string;
    /** Fallback language */
    fallbackLng?: string;
  };
}
For example, to restrict the dashboard to English and Arabic and set Arabic as the default:
app.use(monitor.api({
  basePath: "/monitor",
  i18n: { supportedLngs: ["en", "ar"], lng: "ar" }
}));
Authentication
Since the dashboard is just middleware, you can use standard authentication patterns:
import { basicAuth } from "./auth-middleware";

// Protect the dashboard route
app.use("/monitor", basicAuth);
app.use(createMonitorMiddleware(store, { basePath: "/monitor" }));
Standalone Server
If you prefer to run the dashboard as a separate service (e.g., to view production logs locally), you can create a simple server script:
// dashboard-server.ts
import { createServer } from "node:http";
import { FileAdapter } from "@node-llm/monitor";
import { MonitorDashboard } from "@node-llm/monitor/ui";

const adapter = new FileAdapter("./production-logs.json");
const dashboard = new MonitorDashboard(adapter, { basePath: "/" });

const server = createServer(async (req, res) => {
  await dashboard.handleRequest(req, res);
});

server.listen(3333, () => {
  console.log("Dashboard at http://localhost:3333");
});
See examples/demo/index.ts in the repository for a complete implementation.
API Endpoints
The dashboard backend exposes these endpoints (relative to your basePath):
| Endpoint | Method | Description | Params |
|---|---|---|---|
/api/stats | GET | Aggregate statistics | from (Date) |
/api/metrics | GET | Time-series data for charts | from (Date) |
/api/traces | GET | List of request traces | limit, offset |
/api/events | GET | Detailed events for a request | requestId (Required) |
Example Query
# Get traces
curl "http://localhost:3333/monitor/api/traces?limit=10"

# Get specific request details
curl "http://localhost:3333/monitor/api/events?requestId=req_12345"